

What is a "Data Product"?
Never fear. This page gives a brief explanation and examples of typical data products.
Your needs may vary from these typical products. When we discuss your problem, we'll work together to identify the kind of data product or solution that is right for you. These examples show ways data may be used to simplify life, not the only ways.
Reproducible Reports
Explained
Many of the documents that we produce are repeated. They are intended to communicate a particular thing that we have communicated before, and we will likely communicate again. Usually, there are parts of these documents that stay the same over time or over project/client/etc. Adopting reproducible reports changes the level of interaction we have with these kinds of reports. Here's a story of two processes:
The Manual Process
The process is one that you are all too familiar with.
- You get the new data: annual metrics, weekly sales, daily production counts, etc. Let's just assume it is clean and valid data
- You open the most recent document
- Search for all of the places where the new information will update
- Copy and paste the new data in in
- You update all of the related - things like, "X increased" or "X is not meeting the goal "
- You hope there are no errors, and you save the file
- You may not find all of the places where an update is needed.
- You may copy and paste the wrong data for that placeholder.
- You may not find all of the places where text changes based on the data.
The Reproducible Process
A reproducible process starts by planning the document ahead of filling it in. Imagine a template document where you set up all of the key ideas and then just let the data fill it in. If you've never dealt with mail merge, it is operating on this kind of principle (but it is not the same).
- You get the new data: annual metrics, weekly sales, daily production counts, etc. Let's just assume it is clean and valid data
- You run the document production code
Examples
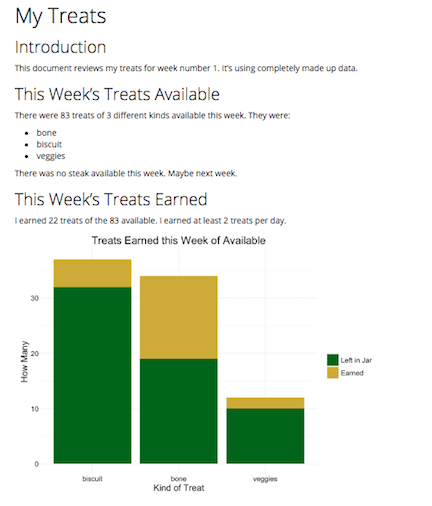
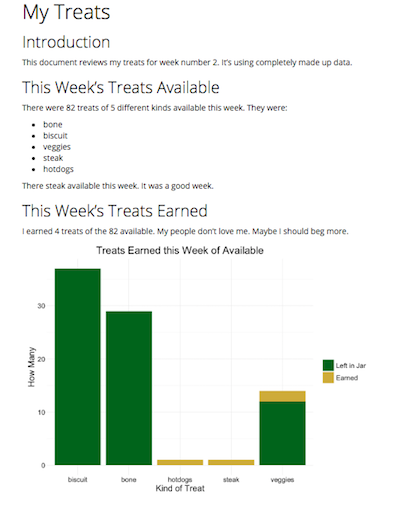
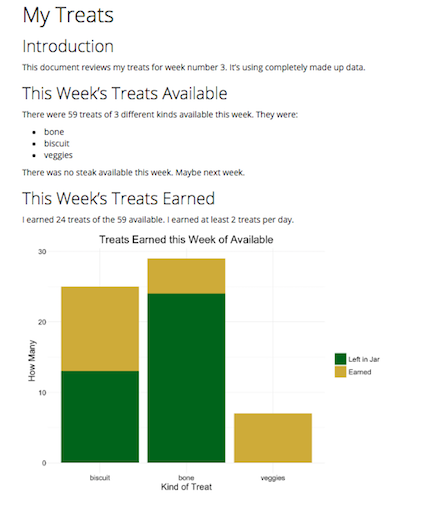
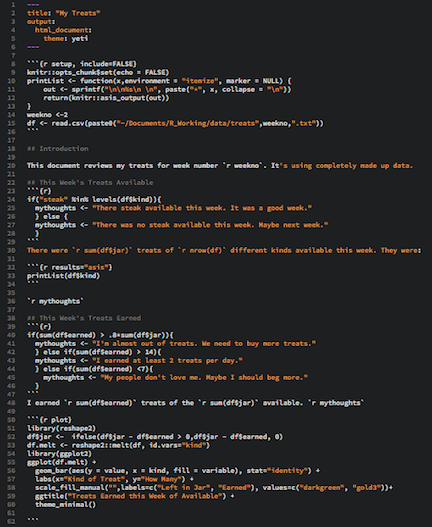
A very simple example of this in process, using R software, is shown in this example. It relies on one very small table of data about dog treats.The Output and Underlying Data
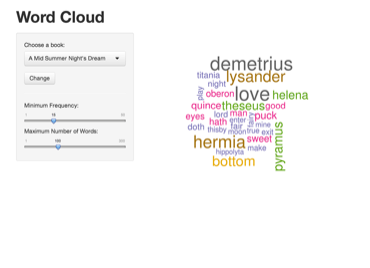
Web Applications
Explained
A web application is a small application that runs some of your custom functions. Consider this - your team members need to run a non-trival function from their local machines or mobile phones that do not have access to software that can process data. The output of the function may be something critical, like estimated project costs; or it may be something educational. Instead of locally calculating items, you can simply enter a few data points and push a button.Examples
Web applications can vary so dramatically; the examples here are links for exploration of web applications. They go to applications in the RStudio Shiny gallery.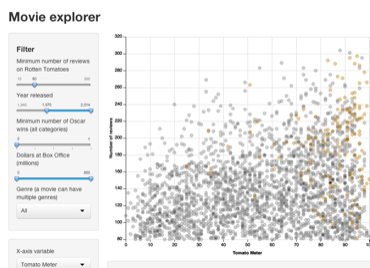
Data Crunching
Explained
Data crunching is not destroying data. Rather, it is getting the meat out. Sometimes you don't have the time, resources, or experience to analyze data effectively.
Examples
Some examples of when data crunching might be useful:
- You have repeated a survey in several different location over time, but you have never compared them. There are some idiosyncracies in the data, such as: different question options, different times of year, or different confounding factors.
- You have a question that might be answered by public data, but you are not sure where to start. For example, what portion of people in three target zipcodes have the characteristics that are of interest to me?
- You expect there is a relationship between some items, but a linear model hasn't helped, and you aren't sure what to do next.
Dashboards
Explained
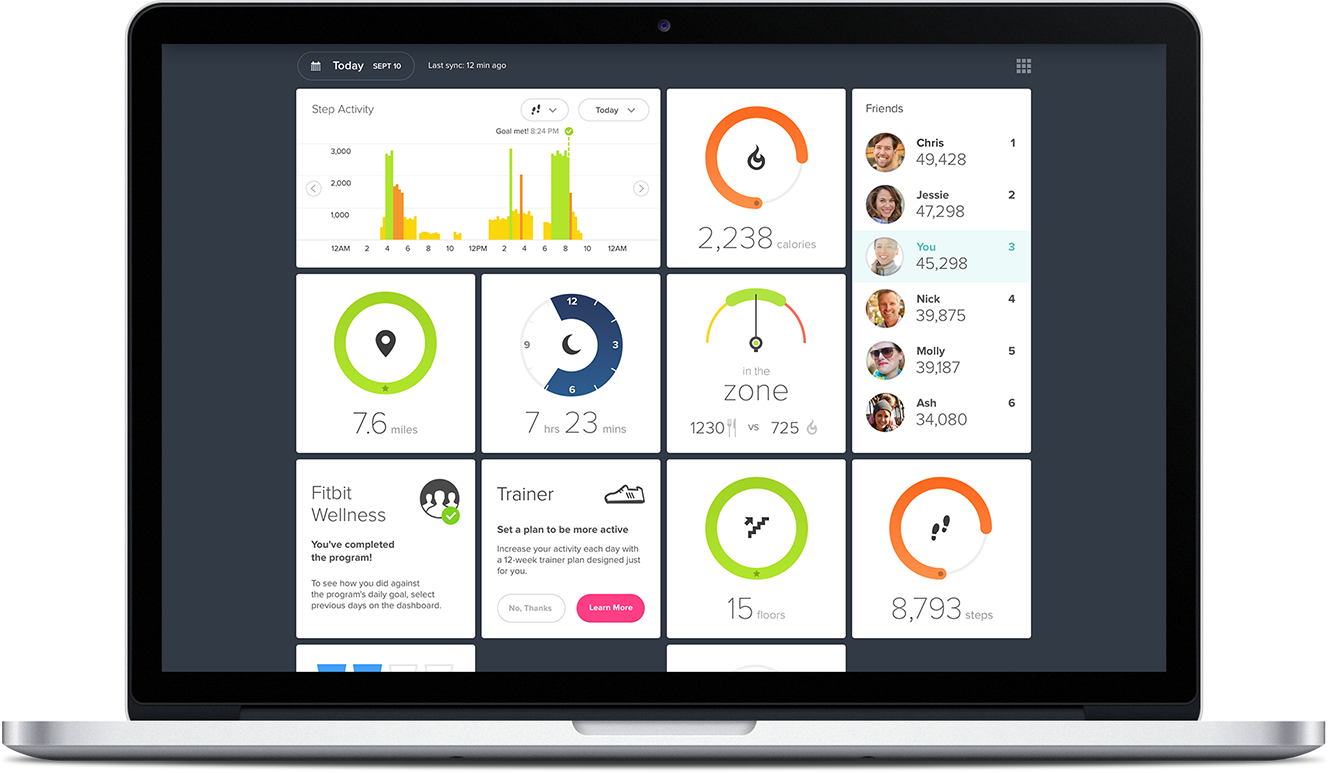
Dashboards are very similar in operation to reprodicible reports. However, dashboards are expected to communicate a snapshot of critical items without all of the text and detail that make up reports. The most critical step in developing dashboards is identifying the key items on which to focus. They can easily become cluttered or focused on things that do not enable users. We can sense this when we look at a dashboard and do not have a single key takeaway. Business leaders use dashboards to identify things like: How much money are we making this month? Do our staff have free hours to devote to other tasks? Which resources are available? Are we on track to meet the target? Regular folks use dashboards to answer questions like: How many steps am I taking? Do I have money in my bank account?
The right dashboard for your purposes may live in the cloud or on your local machine. The key is for it to contain and communicate the metrics that move you forward. Most useful dashboards use simple graphics and little text.
Examples
Some examples of dashboards are here: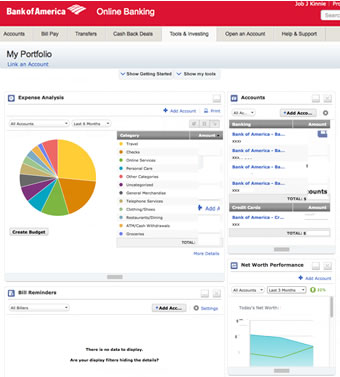
Excel VBA
Explained
Excel, the very common spreadsheet application, is extendable with VBA. You may have encountered spreadsheets that gave you a warning and asked if you wanted to "enable macros" - they are asking you if you want to be able to use the code that is written in VBA and attached to that spreadsheet. The warning is because there could be malicious code in VBA. Most VBA is written for good...to make life with Excel a little easier. VBA might be used to create tools or calculators in Excel, to automate complex functions, or simply to prevent errors possible from copying and pasting formulas across cells. Microsoft wrote some detailed documentation for how VBA can work within their documentation for developers using VBA on GitHub.
VBA can be used for other applications, like PowerPoint and Outlook, but their use is far less common for data handling.
Example
We create a trival macro in VBA that is happy if there are bones.
Sub Bones()
    If Worksheets(1).Range("A1").Value = "Yes!" Then
        Dim i As Integer
        For i = 2 To 4
            Worksheets(1).Range("A" & i).Value = "wags tail!" & i
        Next i
    Else
        MsgBox "Give me bones, and say you did in cell A1"
    End If
End Sub | A | B | C | |
| 1 | Yes! | ||
| 2 | |||
| 3 | |||
| 4 |
| A | B | C | |
| 1 | Yes! | ||
| 2 | wags tail! | ||
| 3 | wags tail! | ||
| 4 | wags tail! |
Packaged Code
Explained
Packaged Code is code in a packaged and documented form. Depending on the language, this may be called a framework, a module, a library, or a package. The common factor is that the functions can be re-used -- not only re-used, but re-used by people who did not create them. This extends the fantastic work that Mike in accounting developed for creating a beautiful trend plot over to Sally in finance (names are made up). Now, Sally can use Mike's function to keep the output consistent.
Example
When you really need to package up your code into a package, it is complex, specific, and detailed. This example shows the packaging of trivial code on the left so that it can be used as shown on the right.Code that is a Candidate for Packaging
The same functions are essentially being declared in each file to do the same thing. The user is copying and pasting - or worse, spending time to re-consider and re-define the functions each time.
addSeven = function(x) {
           out = x + 7
           }
findPercent = function(x, y) {
           out = round((x/y)*100,1)
           }
a = addSeven(mynumber)
print(a)
b = findPercent(a/mybigger)
print(b)
addTwenty= function(x) {
           out = x + 20
           }
findPercent = function(x, y) {
           out = round((x/y)*100,1)
           }
a = addTwenty(myothernumber)
print(a)
b = findPercent(a/mybigger)
print(b)
After Packaging
The functions are declared in a dedicated file with documentation. Users can review the documentation to ensure that they have the correct function. The user then calls the functions. This example shows some additional repeated actions that could be improved, and each package decision will require consideration of what output will be finally used.
# declare my functions
addSome = function(x, z) {
# this function adds z to x and outputs the total
# x and z must be real numbers
           out = x + z
           }
findPercent = function(x, y) {
# this function gets the percent of y represented by x, rounded to 1 tenth (0.0)
# y should not be 0
           out = round((x/y)*100,1)
           }
# file 1
load(mypackage)
a = addSome(mynumber, 7)
print(a)
b = findPercent(a/mybigger)
print(b)

# file 2
load(mypackage)
a = addSome(myothernumber, 20)
print(a)
b = findPercent(a/mybigger)
print(b)